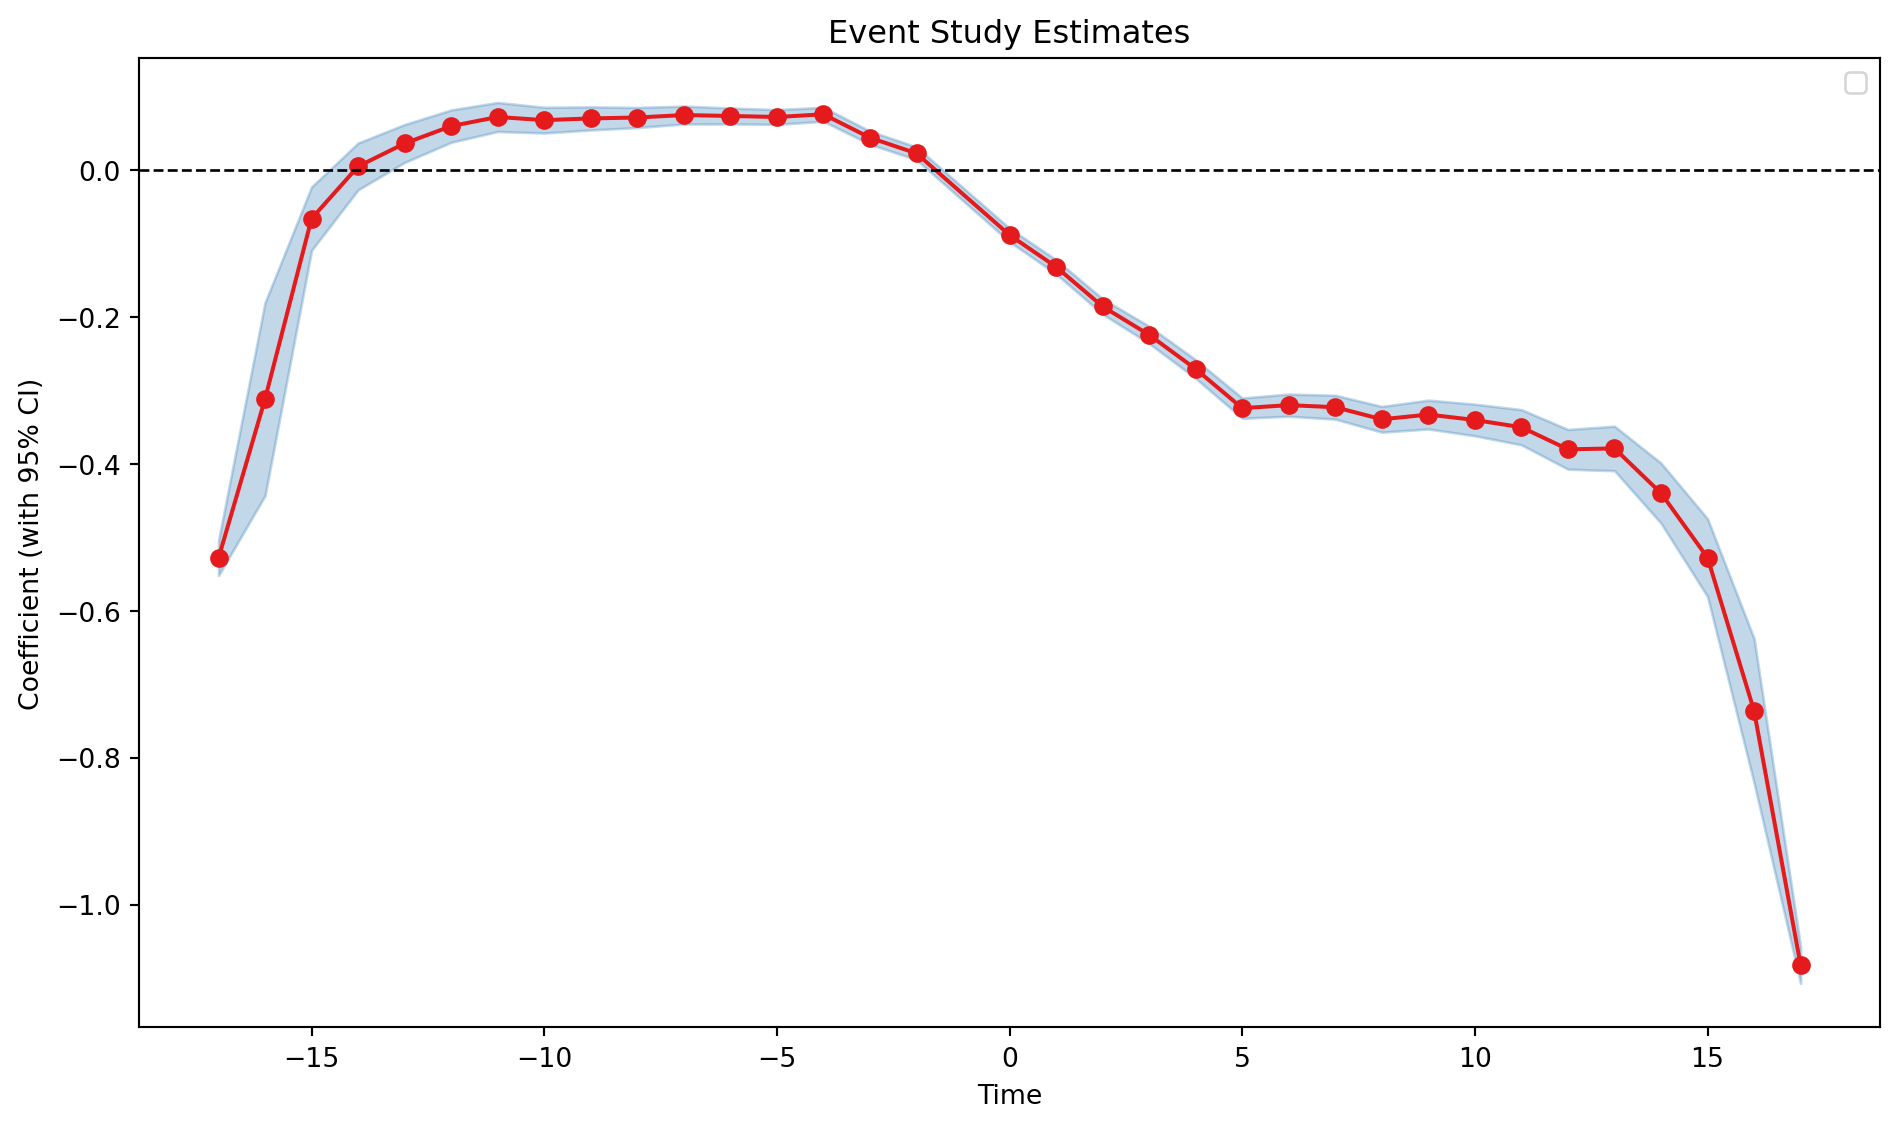
Saturated event study with cohort-specific effect curves.
Attributes
Name
Type
Description
data
pd.DataFrame
Dataframe containing the data.
yname
str
Name of the outcome variable.
idname
str
Name of the unit identifier variable.
tname
str
Name of the time variable.
gname
str
Name of the treatment variable.
cluster
str
The name of the cluster variable.
xfml
str
Additional covariates to include in the model.
att
bool
Whether to use the average treatment effect.
display_warning
bool
Whether to display (some) warning messages.
Notes
Fits a fully saturated event study that interacts every treatment cohort with every relative period. Each cohort has its own set of event time effects, which avoids the comparisons between already-treated units that bias static two-way fixed effects under heterogeneous treatment effects (Sun and Abraham 2021, Journal of Econometrics).
Examples
Returned by event_study() with estimator="saturated". aggregate() aggregates the cohort-specific effects by event time.
Aggregate the fully interacted event study estimates by relative time, cohort, and time.
Parameters
Name
Type
Description
Default
agg
str
The type of aggregation to perform. Can be either “att” or “cohort” or “period”. Default is “att”. If “att”, computes the average treatment effect on the treated. If “cohort”, computes the average treatment effect by cohort. If “period”, computes the average treatment effect by period.
'period'
weighting
str
The type of weighting to use. Can be either ‘shares’ or ‘variance’.
'shares'
Returns
Name
Type
Description
pd.Series
A Series containing the aggregated estimates.
SaturatedEventStudy.estimate
estimate()
Estimate the model.
Returns
Name
Type
Description
Feols
The fitted Feols model object.
SaturatedEventStudy.iplot
iplot()
Plot DID estimates.
SaturatedEventStudy.iplot_aggregate
iplot_aggregate(agg='period', weighting='shares')
Plot the aggregated estimates.
Parameters
Name
Type
Description
Default
agg
str
The type of aggregation to perform. Can be either “att” or “cohort” or “period”. Default is “att”. If “att”, computes the average treatment effect on the treated. If “cohort”, computes the average treatment effect by cohort. If “period”, computes the average treatment effect by period.
'period'
weighting
str
The type of weighting to use. Can be either ‘shares’ or ‘variance’.
'shares'
Returns
Name
Type
Description
None
SaturatedEventStudy.summary
summary()
Get summary table.
SaturatedEventStudy.test_treatment_heterogeneity
test_treatment_heterogeneity()
Test for treatment heterogeneity in the event study design.
Parameters
Name
Type
Description
Default
by
str
The type of test to perform. Can be either “cohort” or “time”. Default is “cohort”. If “cohort”, tests for treatment heterogeneity across cohorts as in Lal (2025). See https://arxiv.org/abs/2503.05125 for details.